Understand grip pressure, finger forces and release timing throughout the golf swing
The hand transmits all forces to the club.
Hand force control means club control
Position of fingers and forces of both hands are measured
Data are sent to a tablet and stored there.
Synchonized with force data, your swing is filmed by the same tablet
Automatic extraction of your swing data and automatic comparison with your goal
You get immediate feedback about force and timing and what to do.
You continue the cycle until your swing signature isw steady (about – 100 swings)
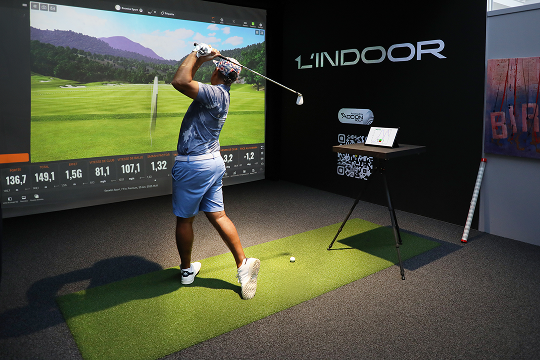
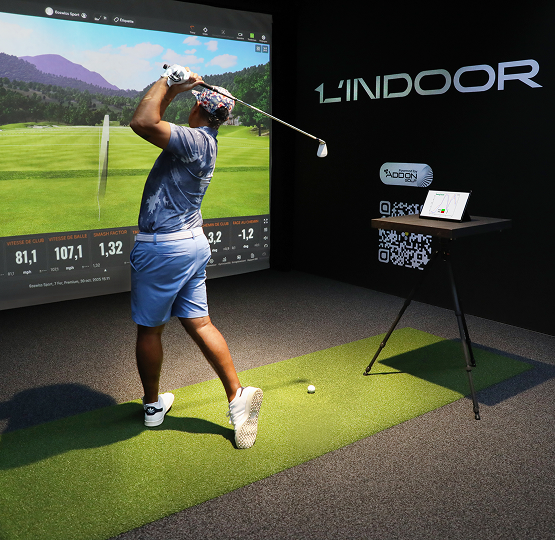
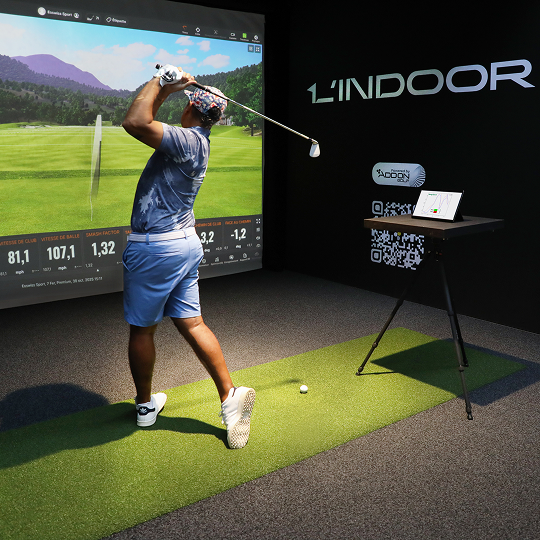
Here a typical situation in an indoor golf. The measurement tablet is on the right. Result and feeback is displayed there.
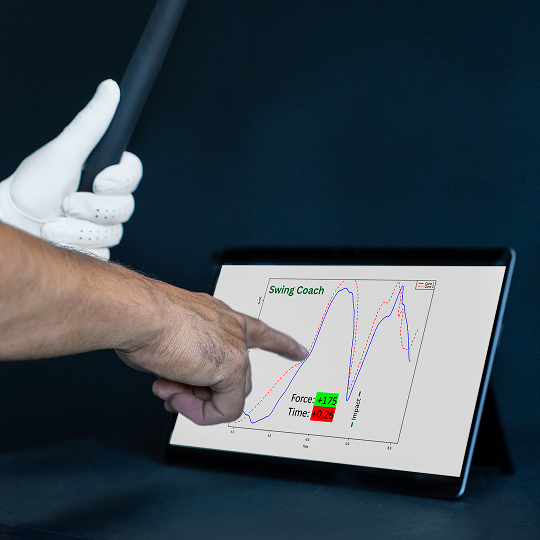
Here you see a feedback screen, which appears after every swing (“Swing coach”).
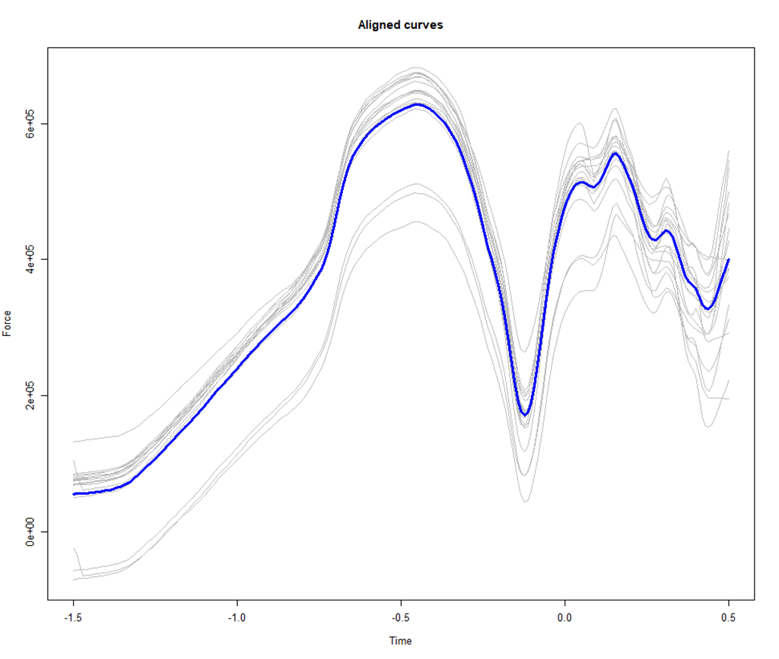
The two peaks in the curves represent backswing (first peak) and downswing (the valley) and impact – the second peak.
Two swings are compared. The goal = blue line and the last swing = red line.
You see immediately where you have applied a too high force or too low force compared to your ideal swing. You also get a force value , in green if in normal range and red if outside.
The second number is impact timing. In red if not OK, in green if OK. Impact timing is an extremely important parameter. It cannot be measured otherwise.
Launch monitors measure the results.
We measure the reasons.
Measures
Measures
Improve the repeatability of your results through improved repeatability of your hand force development – your “swing – signature”.
Every golfer has a very personal force profile over backswing, downswing and impact. We call it
because it is characteristic for each person, like a hand writing.
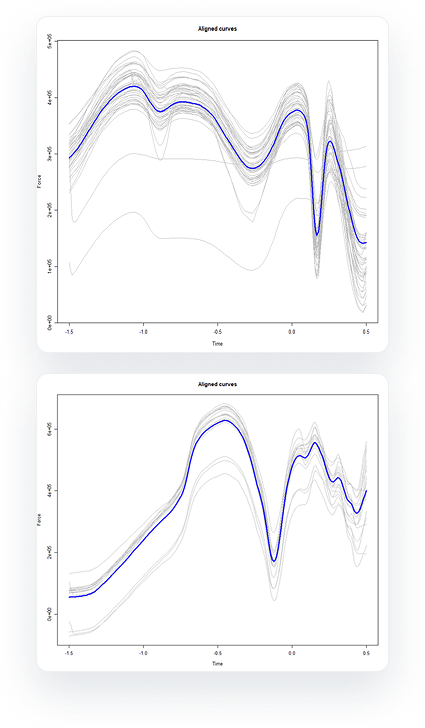
In the 2 graphs you see the swing signature of two pro golfers.
Their results (in distance) are similar, however their swing signatures are very different.
There is no glob al “best swing”!
There is only a “your personal best swing”.
The whole rubber grip is your sensor. Position and forces of fingers and hand balms are measured and transmitted (no wires) to the tablet.
You see your swing results immediately on the tablet. But can analyze much deeper than that. All data are stored and are ready for a structured analysis later on.
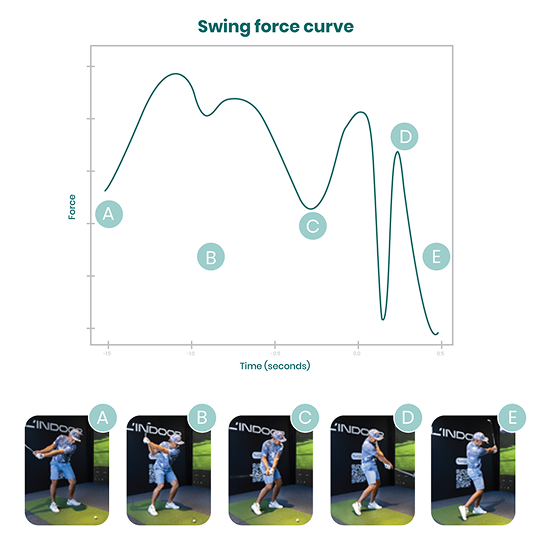
Example Curve
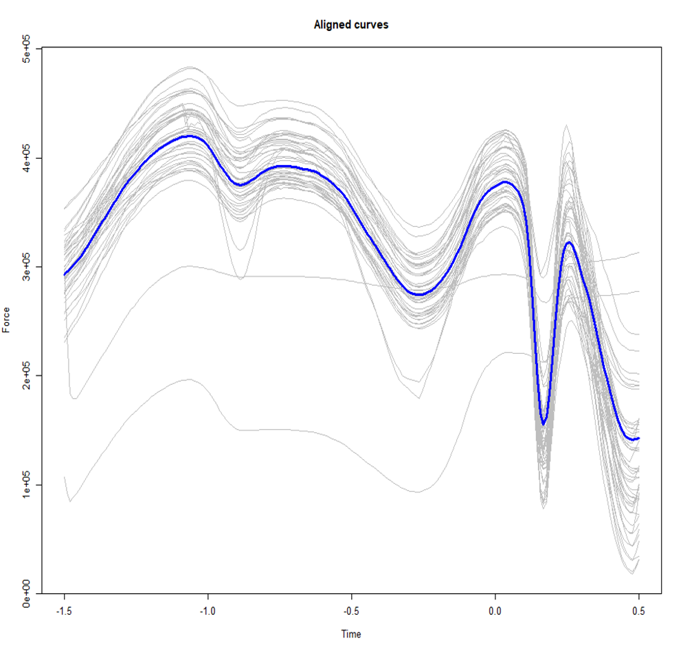
A “total force “ curve is shown in the graph. This curve represents the sum of both hand forces on the grip.
Backswing phase: every golfer has a very personal “swing signature”
Less variability in your hands translates into less variability in your results.
The peak between C and D. Here your hands decide…
Follow through, finish. Important information about your biomechanics.

We say: Your hand forces determine to a large extent how you transfer your energy to the club. Your hand force determine to a large extent your result.
it must be possible to predict the swing result (= ball flight) from hand force measurements. Is this true?
The Graph shows the relation between observed (real) ball flight distance to predicted ball flight distance. And indeed, we see predictions from hand force measurements predict the swing results. Every point in the graph represents a swing.
There is scatter in the data- yes! But regarding that no other information (e.g movement, ground force ) were used, the correlation is remarkably good.
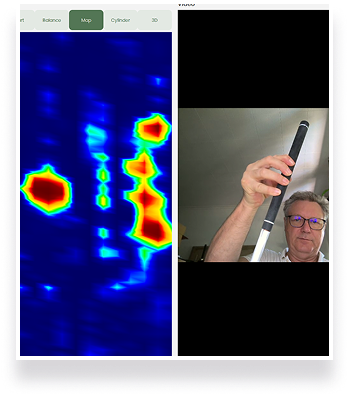
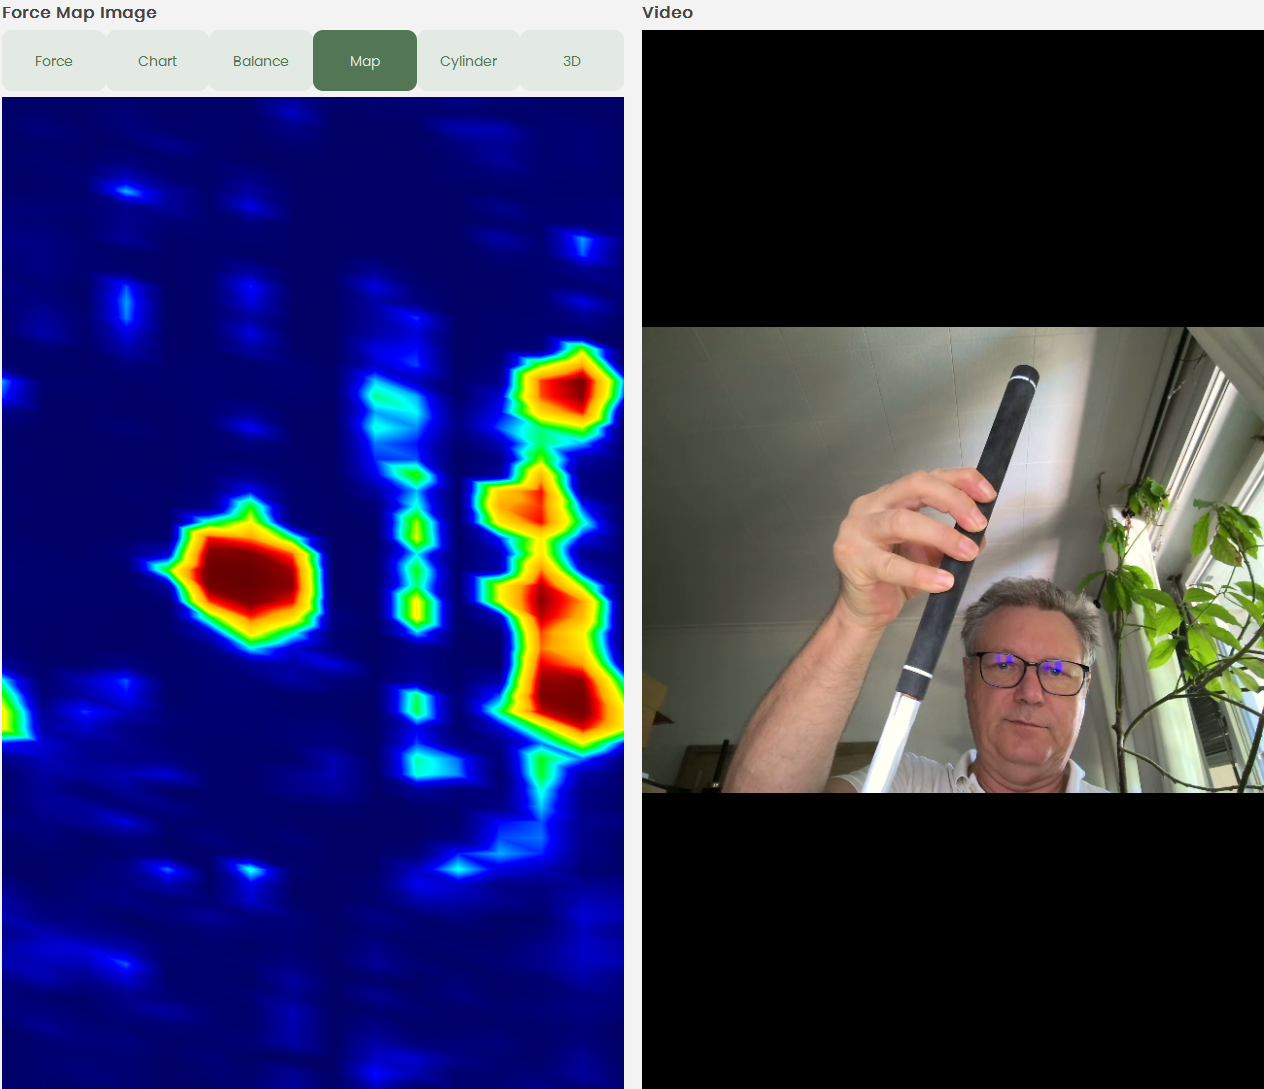
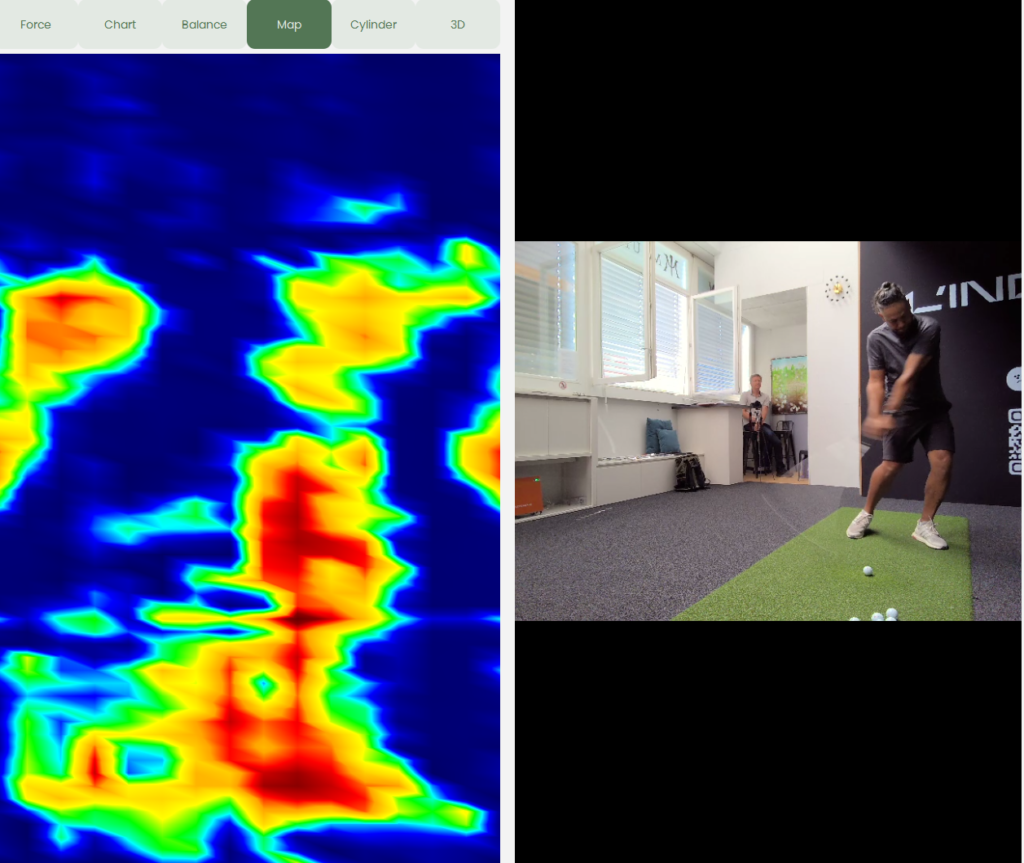
Presure map of a professional golfer at impact (left). The pressure map is an image of the complete grip surface. iron side of grip on top.
Video at impact (right).
How we see the future